Advent of Cyber 2025 | Challenge 3: Splunk Basics – Did You SIEM?

“Logs don’t lie — but they do hide.”
Before alerts, before dashboards, before incident calls —
there are logs.
A SIEM (Security Information and Event Management) tool is where all those logs come together.
It ingests data from web servers, firewalls, endpoints, and applications, allowing security teams to search, correlate, and investigate events across the environment.
In this challenge, that SIEM is Splunk — one of the most widely used tools in modern SOCs.
Scenario: Something Went Wrong…
TryHackMe’s Advent of Cyber 2025 drops us straight into a real-world situation.
A company’s environment has started behaving strangely:
- Unusual web traffic
- Suspicious activity patterns
- Signs of an active attack
Getting Started with Splunk
Anomaly Detection
To see the spike in the web traffic, timechart command comes very handy:
index=main sourcetype=web_traffic
| timechart span=1d count
This query gives us the visibility into web traffic on a daily basis.
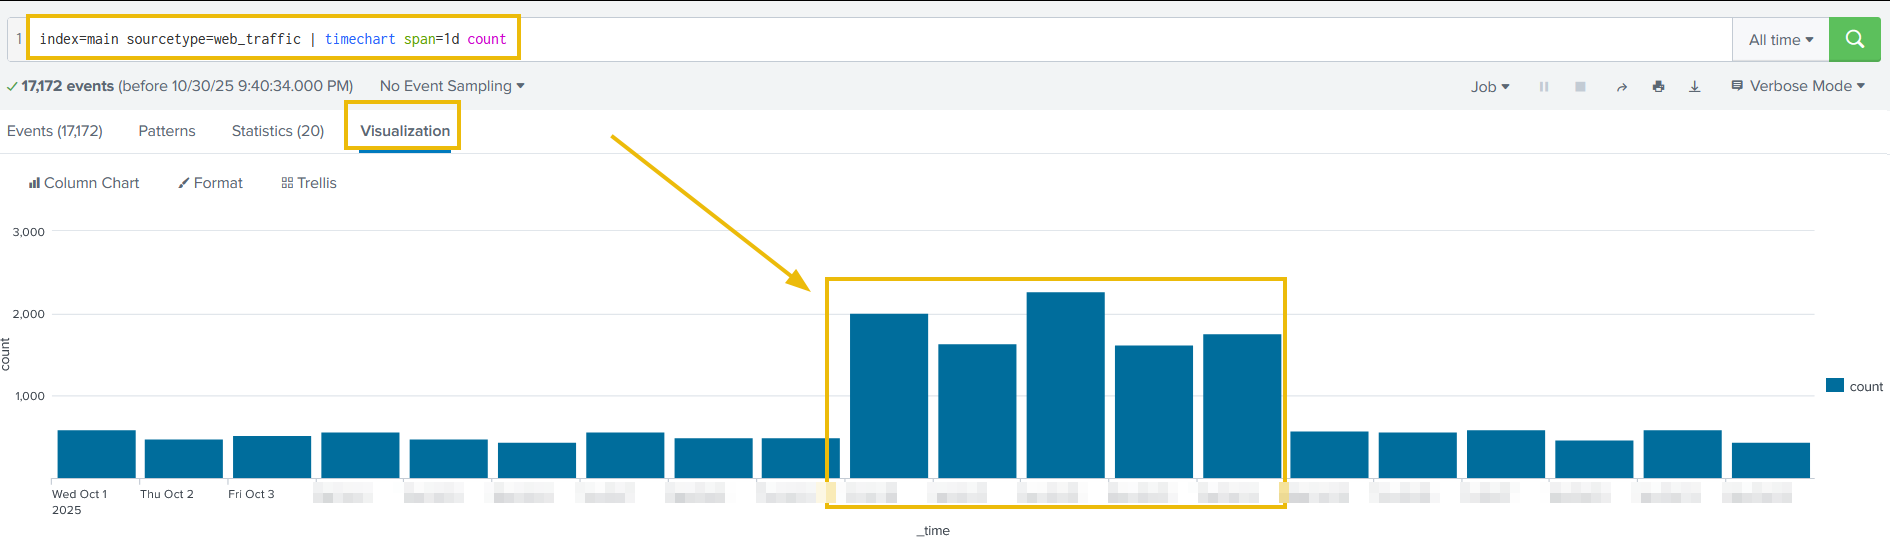
This helps identify peak activity days, often correlating directly with attacker behavior.
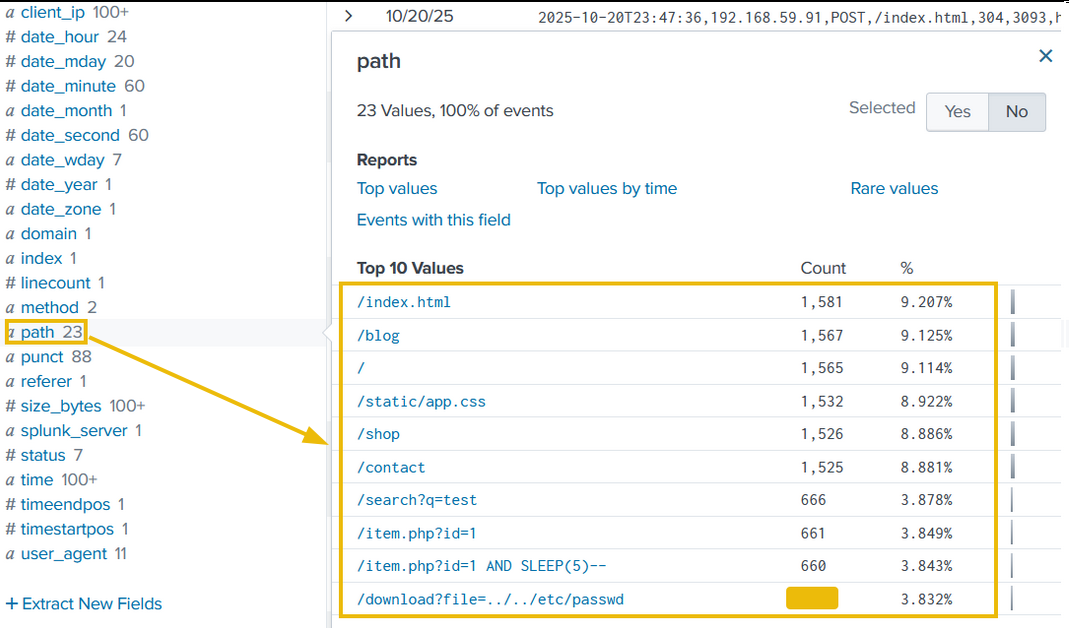
Some of the interesting fields in web traffic logs that we should always look out for are:
- client_ip
- user_agent
- path
1. Hacker’s IP
High-frequency IPs with unusual user agents are often the attacker. And to find the most active IPs we can use the following SPL query in Splunk:
index=main sourcetype=web_traffic
index=main sourcetype=web_traffic
| stats count by client_ip
| sort -count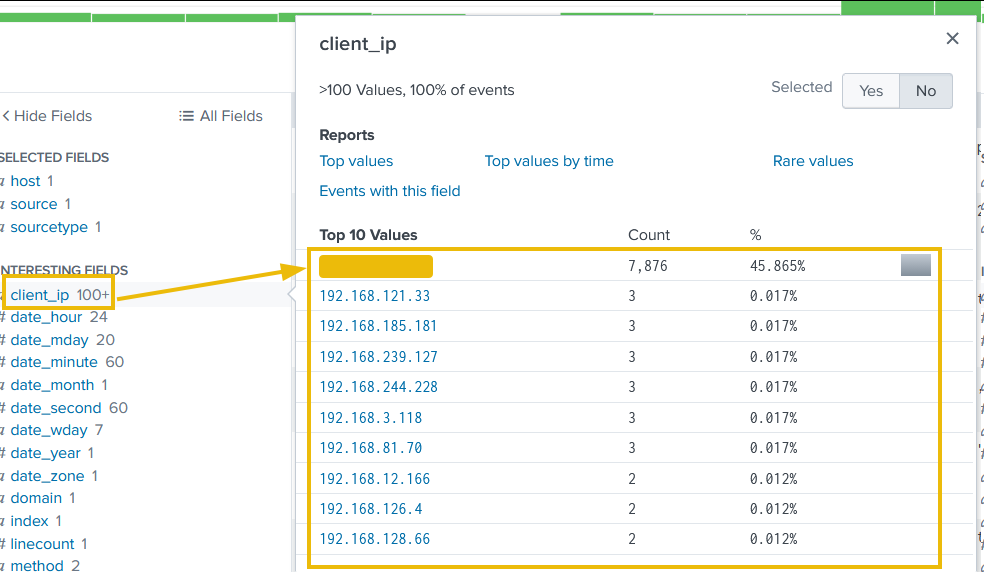
2. User Agents
High-frequency IPs with unusual user agents are often the attacker.
index=main sourcetype=web_traffic
| search user_agent!="*Mozilla*" user_agent!="*Chrome*"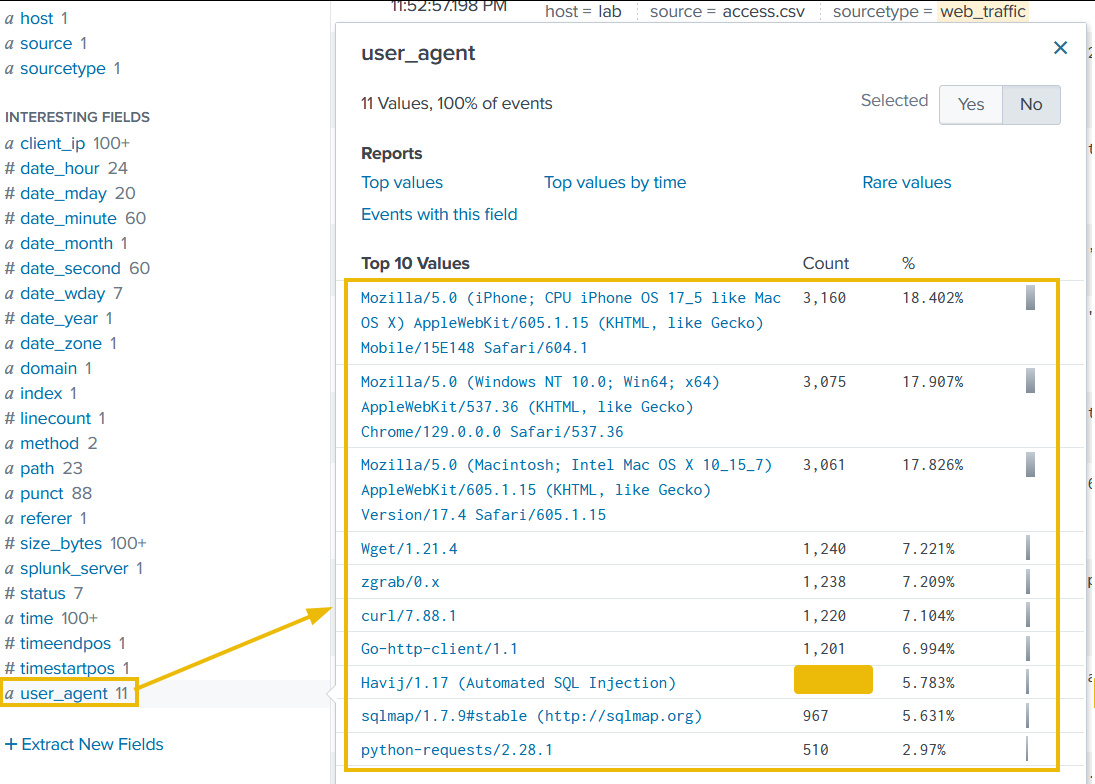
3. Path
The third field we will examine is path, which contains the URL being requested and accessed by the client IPs. The results shown below clearly indicate some path worth investigating.
Tracing the Attack Chain
Reconnaissance (Footprinting)
Every attack starts quietly.
Before exploiting anything, attackers probe for exposed configuration files and development leftovers that may leak sensitive information.
We should begin by searching for requests targeting common high-value paths:
sourcetype=web_traffic client_ip="<Attacker_IP>" AND path IN ("/.env", "/*phpinfo*", "/.git*") | table _time, path, user_agent, statusEnumeration (Vulnerability Testing)
Once the server responds, the attacker escalates to testing for weaknesses such as path traversal and open redirect vulnerabilities.
We can search for traversal and redirect payloads with this SPL query:
sourcetype=web_traffic client_ip="<Attacker_IP>" AND path="*..\/..\/*" OR path="*redirect*" | stats count by pathSQL Injection Attacks
With potential weaknesses identified, the attacker attempts exploitation.
We should start looking for automated SQL injection tools by searching for their common user agents:
sourcetype=web_traffic client_ip="<Attacker_IP>" AND user_agent IN ("*sqlmap*", "*Havij*") | table _time, path, statusExfiltration Attempts
After gaining access, attackers often attempt to quickly download sensitive data such as backups or logs.
We can search for requests targeting common archive files:
sourcetype=web_traffic client_ip="<Attacker_IP>" AND path IN ("*backup.zip*", "*logs.tar.gz*") | table _time path, user_agentRansomware Staging & Remote Code Execution (RCE)
To observe suspicious requests involving a webshell and a ransomware-like binary. we can use following SPL query:
sourcetype=web_traffic client_ip="<Attacker_IP>" AND path IN ("*bunnylock.bin*", "*shell.php?cmd=*") | table _time, path, user_agent, statusCorrelating Outbound C2 Communication
Web logs are not the only thing we should investigate in such scenaiors. To validate post-exploitation activity, we pivot from web logs to firewall logs.
Using the compromised server IP as the source and the attacker IP as the destination, we can see if there is some abnormal amount of data being transferred from our server to an external server:
sourcetype=firewall_logs src_ip="<Victim_IP>" AND dest_ip="<Attacker_IP>" AND action="ALLOWED" | stats sum(bytes_transferred) by src_ipConclusion
By correlating multiple log sources, we can reconstruct the full intrusion timeline:
-
Identity found: The attacker can identified via the highest volume of malicious web traffic from a single external IP.
-
Reconnaissance: Automated probes targeting configuration files and traversal payloads.
-
Exploitation: SQL injection can be confirmed via sqlmap and Havij user agents.
-
Payload delivery: Successful execution of cmd=./bunnylock.bin via a webshell.
-
C2 confirmation: Firewall logs can confirm outbound communication from the compromised server to attacker infrastructure.